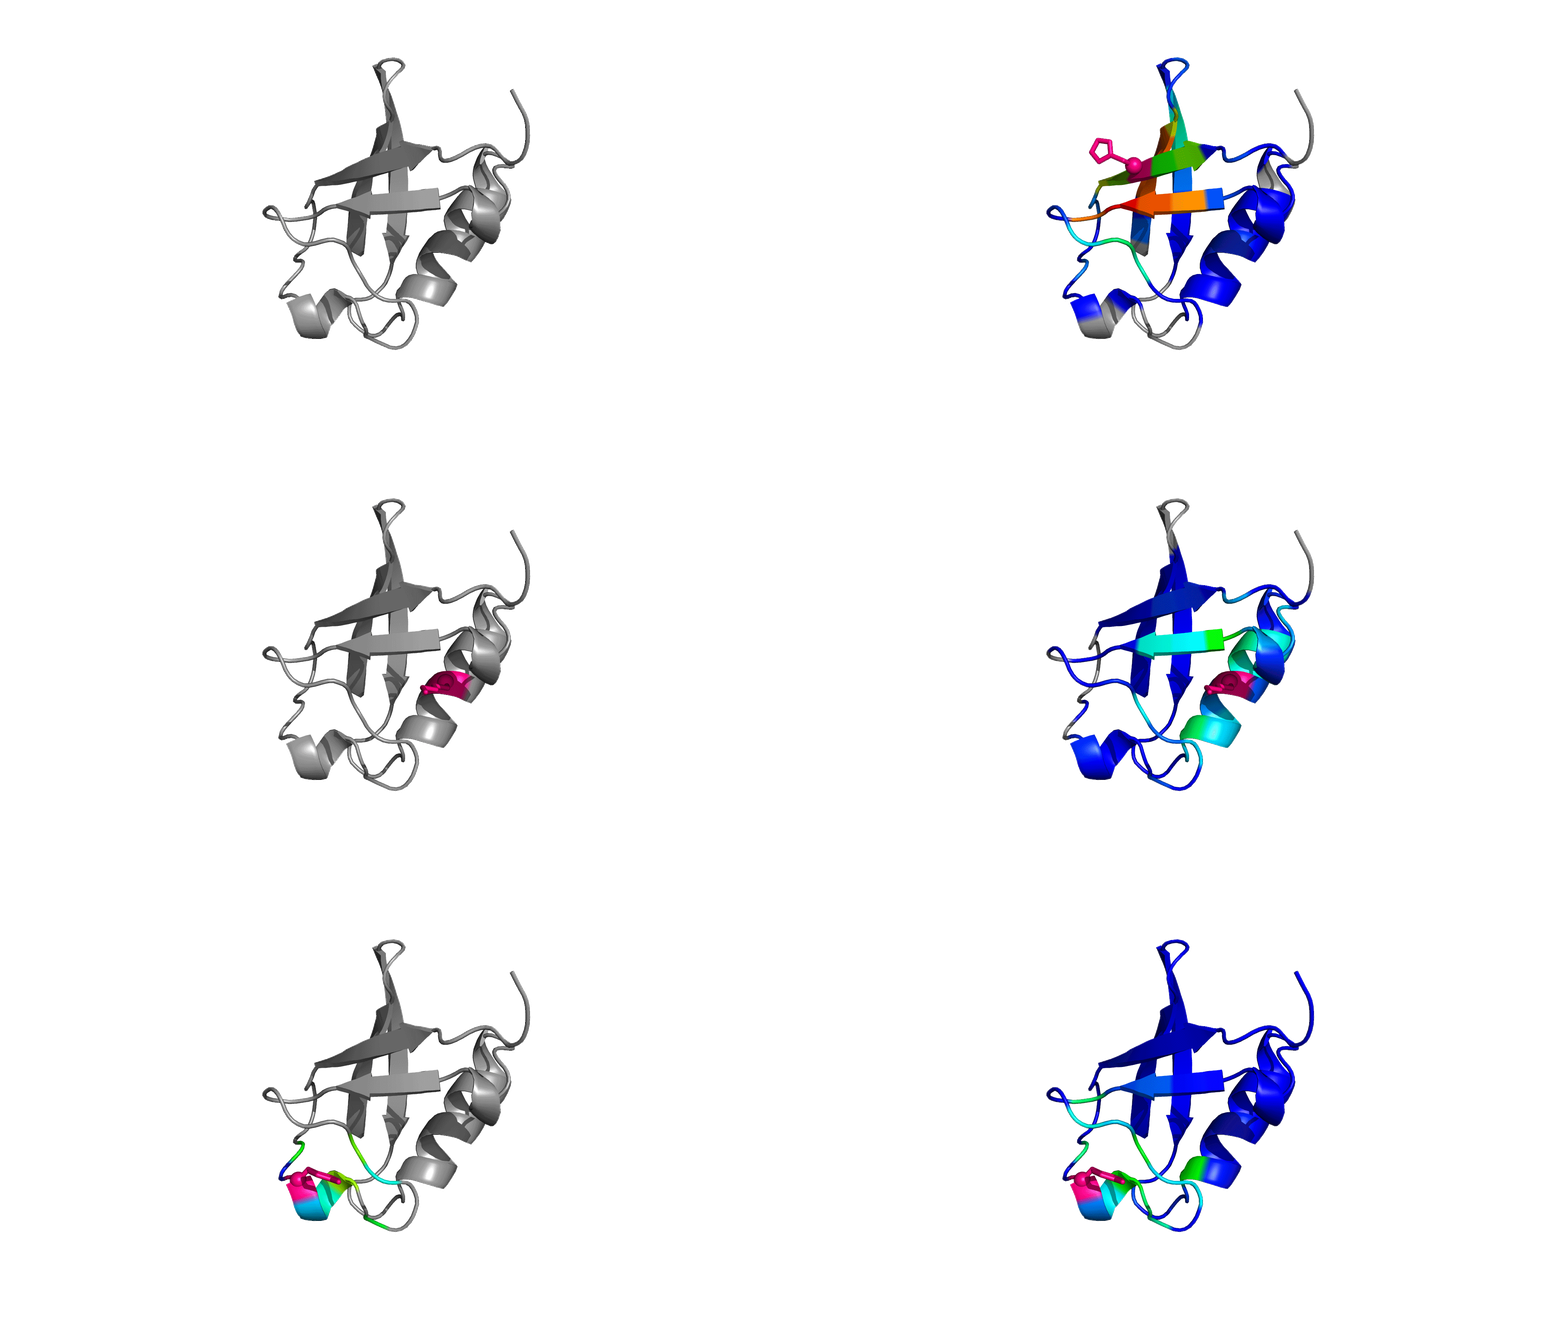
Comparing Interaction-Network Profiles
Note: Residues are numbered based on the reference structure
Coloring based on ∑∆Q (T) - ∑∆Q (R)
NOTE: Use your mouse to drag, rotate, and zoom in and out of the structure
Click here to render publication quality image
Download PDB
Click here to render publication quality image
Click on download to save the results in plain text format
D O W N L O A D
NOTE: Hover mouse over data-point to see value and select area to zoom.
Coloring based on ∑∆Q
Coloring based on dc
NOTE: Use your mouse to drag, rotate, and zoom in and out of the structure.
Click here to render publication quality image.
Download PDB
Download PDB
Click on download to save the results in plain text format.
D O W N L O A D
NOTE: Hover mouse over data-point to see value and select area to zoom.
Click on download to save the results in plain text format.
D O W N L O A D
Protein Biophysics Lab


2019, Maintained by Protein Biophysics Lab, IIT Madras, Chennai-36, India
Last Updated: September 25, 2019