- pPerturb is a simple and fast approach to model the effects of perturbations on protein residues and understand the varied responses of individual residues to the perturbations. It provides a first-order estimate on the extent of perturbation into the protein structure.
- The effect of a perturbation is introduced using empirical relations derived from mutational studies and the resulting contact map is analyzed. The residue specific indices dC and Σ∆Q help in identifying residues that are likely to be important for signal transmission within proteins.
- pPerturb quantifies the partitioning of destabilization energetics around the mutation neighborhood, and presents a simple theoretical framework for modeling the allosteric effects of point mutations and thus the effects on its thermodynamics.
The empirical model is explained in detail here, along with the model parameters and the interpretation of the predicted variables. The web server is briefly divided into four independent modules as described below,
- Generate Perturbation Profile(s): This module allows the users to simulate mutation of one or more residues to alanine and generates perturbation profiles (∆Q vs. Cα-Cα distance from the perturbed site) for select residues.
- Generate Interaction-Network Profile: This module iteratively perturbs all residues in the selected protein chain and estimates the extent of percolation (coupling distance; dC) and the total magnitude of perturbation (Σ∆Q) from the individual perturbation profiles.
- Compare Interaction-Network Profiles: This module allows the users to compare the interaction-network of a protein at two different states. For example, it can be used to quantify the differences in packing between ligand-bound and unbound forms of the same protein.
- Predict Destabilization Thermodynamics: This module simulates the effects of side-chain truncations and predicts the change in stability and the thermal unfolding curve.
To understand the effects of residue perturbation on the interaction-network of a protein, we employ a simple structural perturbation protocol that captures the changes in thermodynamic stabilities induced by point mutations within the protein interior (Rajasekaran N et al, 2017). With just the protein contact-map as an input, we reproduce the extent of percolation of perturbations within the structure as observed in network analysis of proteins, molecular dynamics simulations and NMR-observed changes in chemical shifts (Rajasekaran N et al, 2017; Rajasekaran N & Naganathan AN, 2017). Using this rapid protocol that relies on a single structure, we can identify functionally critical sectors, the propagation and dissipation of perturbations within proteins and the higher-order couplings deduced from detailed NMR experiments.
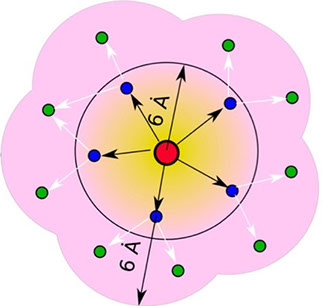
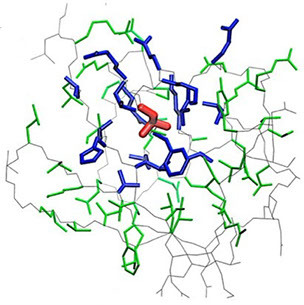
where i is the perturbed residue ( red in figure a & b below), j refers to first shell neighbors ( blue in figure a & b below) and k refers to second shell neighbors ( green in figure a & b below). x1 and x2 are empirical parameters to modulate the extent of perturbation that can be introduced in the first and second shells, respectively, and range from 0 to 1. Different combinations of distance cutoffs and relative destabilizations in the first and second shells (x1 and x2, respectively) were tried in a systematic manner that involved the generation of >100000 unfolding curves Rajasekaran N et al, 2017. The slope, correlation coefficient, and mean absolute error between the experimental and predicted stability changes were calculated for each of the combinations, and the combination that provides a physically reasonable estimate of all three parameters was chosen.
First shell refers to residues within 6 Å from the perturbed residue and second shell refers to residues within 6 Å from first shell residues. nmut and nWT are the number of heavy atoms present in the perturbed residue (including backbone atoms) before and after mutation. Qx,y is the number of contacts in the contact map between any two residues x and y. All the residues except glycine and alanine are mutated to alanine. Alanine is mutated to glycine and glycine is mutated to a virtual residue with 3 atoms.
a
b
The ΔQ values of each residue, (i.e.) the magnitude of perturbation experienced by each residue, are summed up and plotted as a function of distance from the perturbed residue. The plot is fitted to a exponential function to estimate the exponent (dC) value giving insight into the extent of percolation and Σ∆Q explains the total magnitude of perturbation. All the residues are iteratively perturbed using the above approach to obtain the interaction-network profile of the protein, if specified by the user.
A global ΔQ map is constructed by accumulating all the individual residue-level ΔQ maps and is displayed along with the contact map. Secondary interactions which are not apparent in the contact map can be identified from the global ΔQ map.
To predict the folding thermodynamics of the proteins at a residue-level resolution, we employ an extended version of the simple yet detailed c. The WSME model incorporates multiple energetic terms like vdW interactions, electrostatics, solvation, and residue specific conformational entropy in its energy function. In this model, residues are assumed to sample two sets of conformations: folded (native) and unfolded (non-native) that are assigned the binary variables 1 and 0, respectively thus, leading to a total of 2N structured microstates or conformations for an N-residue protein. In the current version of model, the free energy of each microstate is
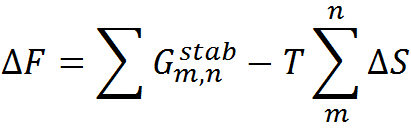
where the effective stabilization free-energy of a particular microstate (m, n) (i.e., a string of 1’s between and including m and n) at a temperature T is represented as a sum of van der Waals interactions (EVdW), electrostatic potential (EElec) and solvation free energy (∆Gsolv). ∆S accounts for the entropic cost or penalty for fixing a residue in the native conformation. The details on the model parameters and the values assigned to them by the server can be found here. Further details on the model and equations to calculate the folding probability of residues can be found in the literature (Wako H & Saitô N, 1978; Muñoz V & Eaton WA, 1999; Naganathan AN, 2012).
Citing pPerturb
1. Nandakumar Rajasekaran, Swaathiratna Suresh, Soundhararajan Gopi, Karthik Raman, and Athi N. Naganathan (2017). A General Mechanism for the Propagation of Mutational Effects in Proteins. Biochemistry, 56, 294–305. ![]()
2. Nandakumar Rajasekaran, and Athi N. Naganathan (2017). A Self-Consistent Structural Perturbation Approach for Determining the Magnitude and Extent of Allosteric Coupling in Proteins. Biochem. J., 474, 2379–2388. ![]()
Further Reading
1. Nandakumar Rajasekaran, Ashok Sekhar & Athi N. Naganathan (2017). A Universal Pattern in the Percolation and Dissipation of Protein Structural Perturbations. J. Phys. Chem. Lett., 8, 4779–4784. ![]()
2. Athi N. Naganathan (2019). Modulation of Allosteric Coupling by Mutations: from Protein Dynamics and Packing to Altered Native Ensembles and Function. Current Opinion in Structural Biology., 54, 1-9. ![]()

pPerturb
Extracting Energetic Couplings and Destabilization Thermodynamics via Perturbations
Protein Biophysics Lab

2019, Maintained by Protein Biophysics Lab, IIT Madras, Chennai-36, India
Last Updated: September 25, 2019